

The web console
tendb ships a Neon-style web console: dashboard, branch management, snapshots, alerts, a schema browser, a SQL editor, and per-branch monitoring. It is one server with two ways to run it:
- Local —
tendb consoleon your machine, over your AWS credentials. Zero setup. - Hosted (optional) — the same server on an EC2 host in your VPC, behind HTTPS and Google login, so your whole team gets a URL.
Local console
Section titled “Local console”tendb consoleThis starts the console on http://localhost:4400 and opens your browser. Options:
| Flag | Default | Meaning |
|---|---|---|
--port <port> | 4400 | Local port (--port 0 picks a random free port) |
--no-open | — | Don’t launch a browser |
The server binds to 127.0.0.1 only and runs until you hit ctrl-c. It serves three things:
- The console single-page app.
- A local JSON API under
/api/*(branch operations, SQL queries, snapshots, alerts, schema tooling). - A transparent proxy of the raw DBLab REST API under
/api/dblab/*.
How it talks to the engine
Section titled “How it talks to the engine”The console uses the same session as every other CLI command: by default an SSM Session Manager port-forward to the engine’s DBLab API on port 2345, or a direct connection when you configure --api-url / TENDB_API_URL. See Configuration for transports and credentials.
Security model: the DBLab verification token and your AWS credentials never reach the browser. The console server injects the Verification-Token header on the proxy path server-side, and SQL queries against branches run through per-clone SSM tunnels that the server opens on demand. If a tunnel dies, the next query respawns it automatically.
The screens
Section titled “The screens”The app shell shows the environment name, transport badge (SSM or DIRECT), database name, engine instance id, a theme toggle, and a status chip (All OK / N warnings / N critical / Syncing / Reconnecting) that jumps to Alerts. A Connect button in the sidebar opens a dialog with any branch’s connection URI (password masked until revealed), the tunnel-local URI when one is open, and a copyable tendb psql <branch> one-liner. If the console can’t reach the engine at all before any data has loaded, a full-screen view distinguishes “console server gone” from “tunnel/engine gone”.
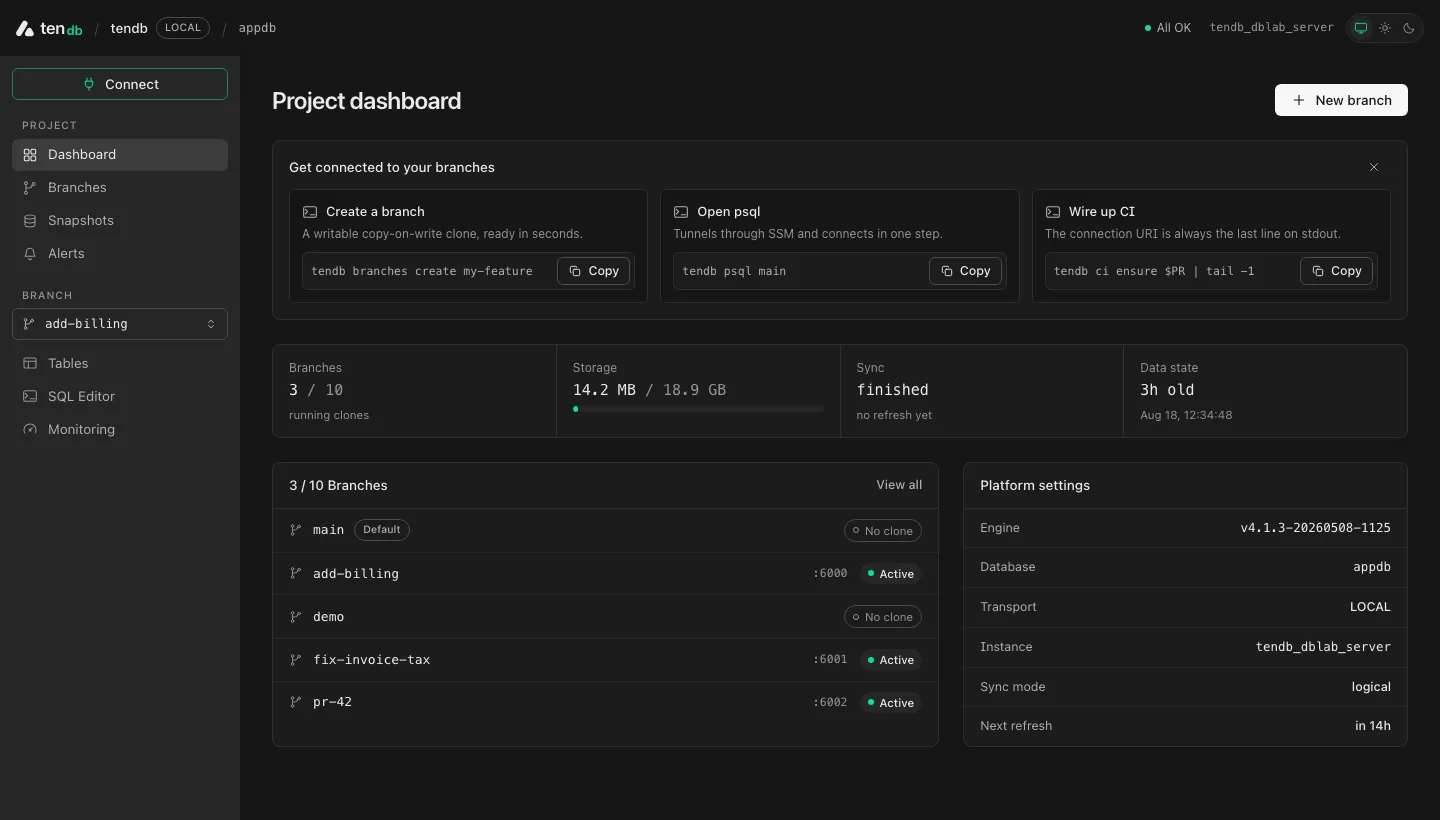
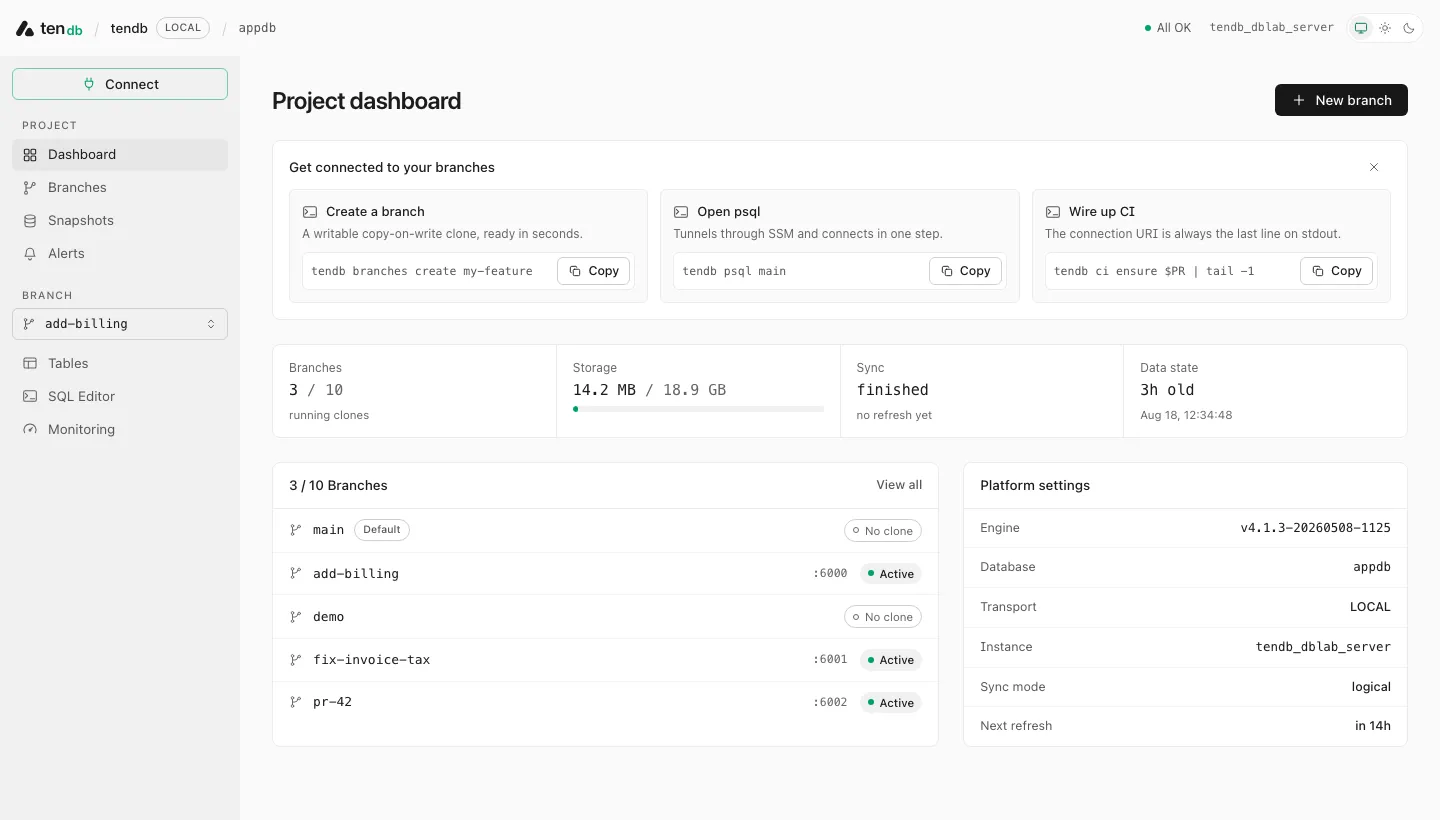
Dashboard — dismissible getting-started cards with copyable CLI commands; metric tiles for branches (clones used vs. capacity), storage (ZFS pool usage), sync status with last refresh, and data-state age; the platform settings panel (engine version, database, transport, instance, sync mode, next refresh); and a New branch dialog. When streaming replication is configured, a source pipeline diagram shows source → sync target → branches with per-hop health.
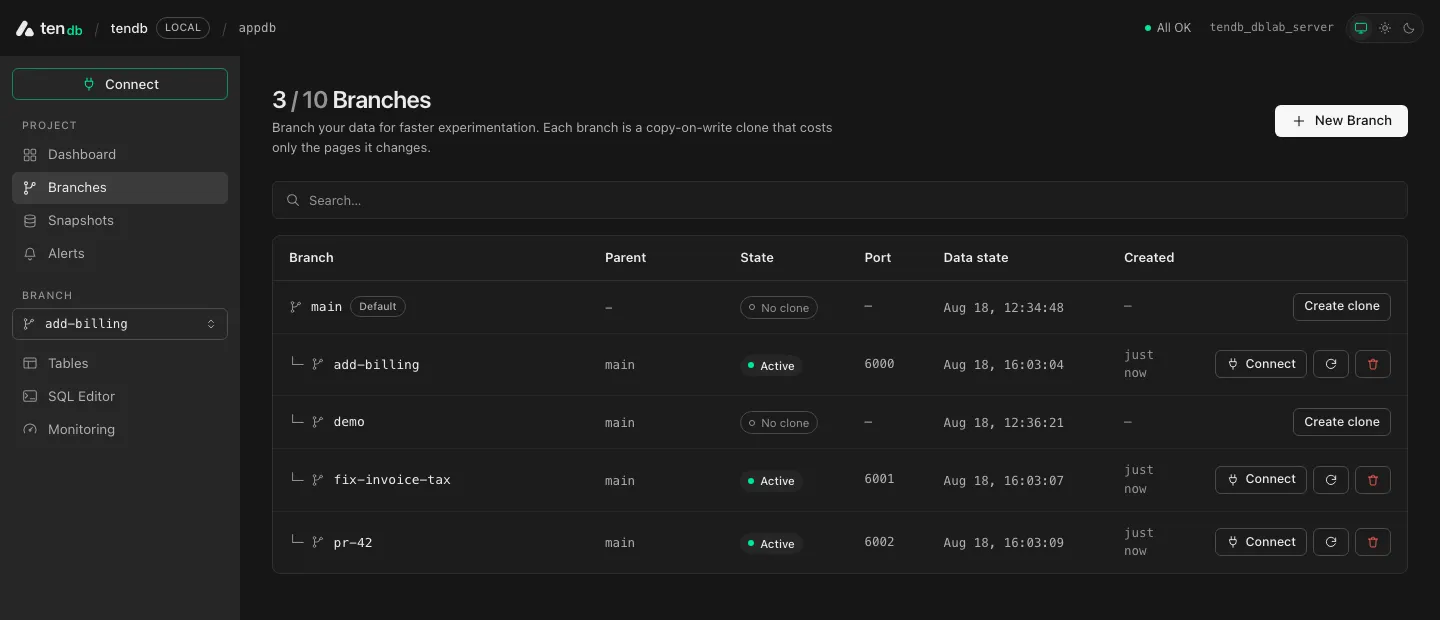
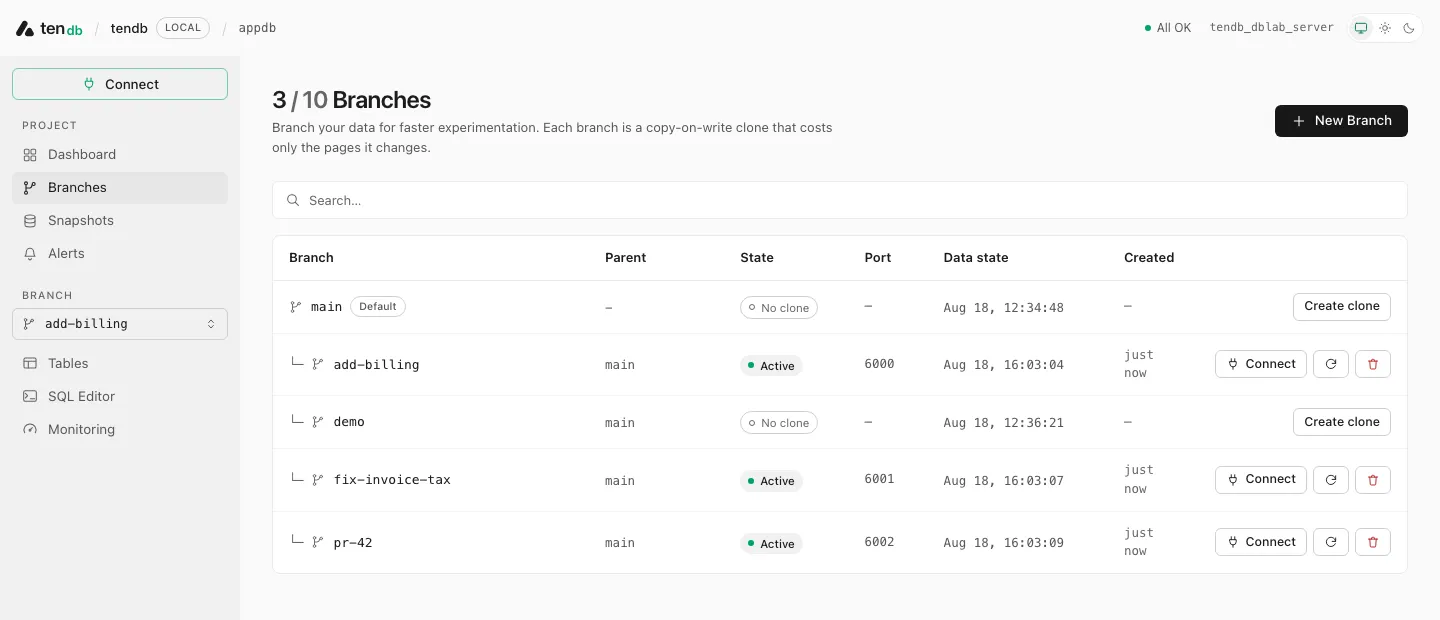
Branches — the full branch table with lineage indentation (branches form a tree via their parent), name search, and per-row state, port, data state, and age. Row actions:
- Connect — expands to the connection URI (masked; the copy button copies the real value) plus a local URI when the console holds a tunnel.
- Create clone — for a branch with no running clone.
- Reset — discards everything written to the clone since it was created (confirm dialog).
- Delete — removes the clone and branch. Hidden for the root branch
main.
The New branch dialog validates the name ([a-z0-9][a-z0-9-]{0,62}), lets you pick a base branch, and — on streaming deployments, when branching from main — offers “Start from the latest data”, which snapshots the live sync target first so the branch is main as of now. On success it shows the connection URI, state, and port. In streaming mode the live main row gets Connect only: it is not a clone, so there is no reset or delete.
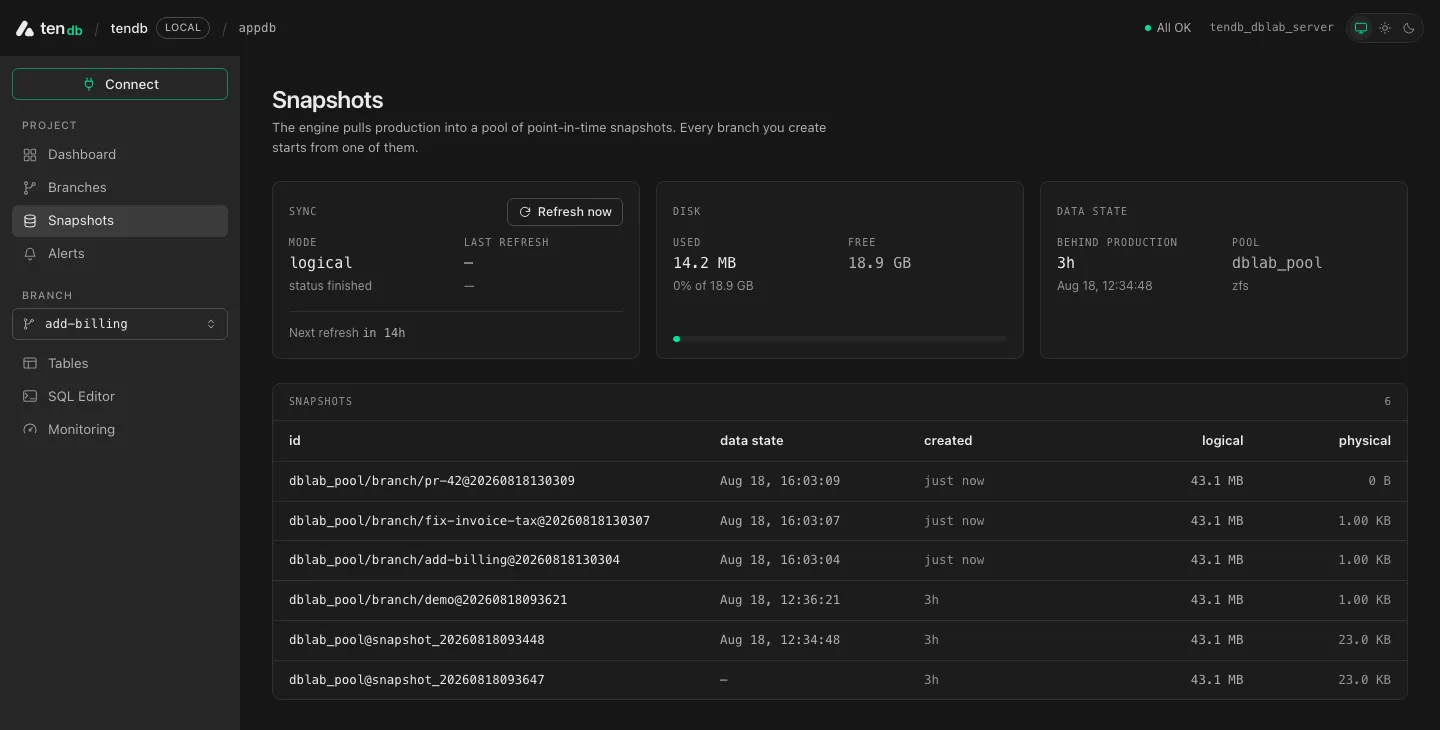
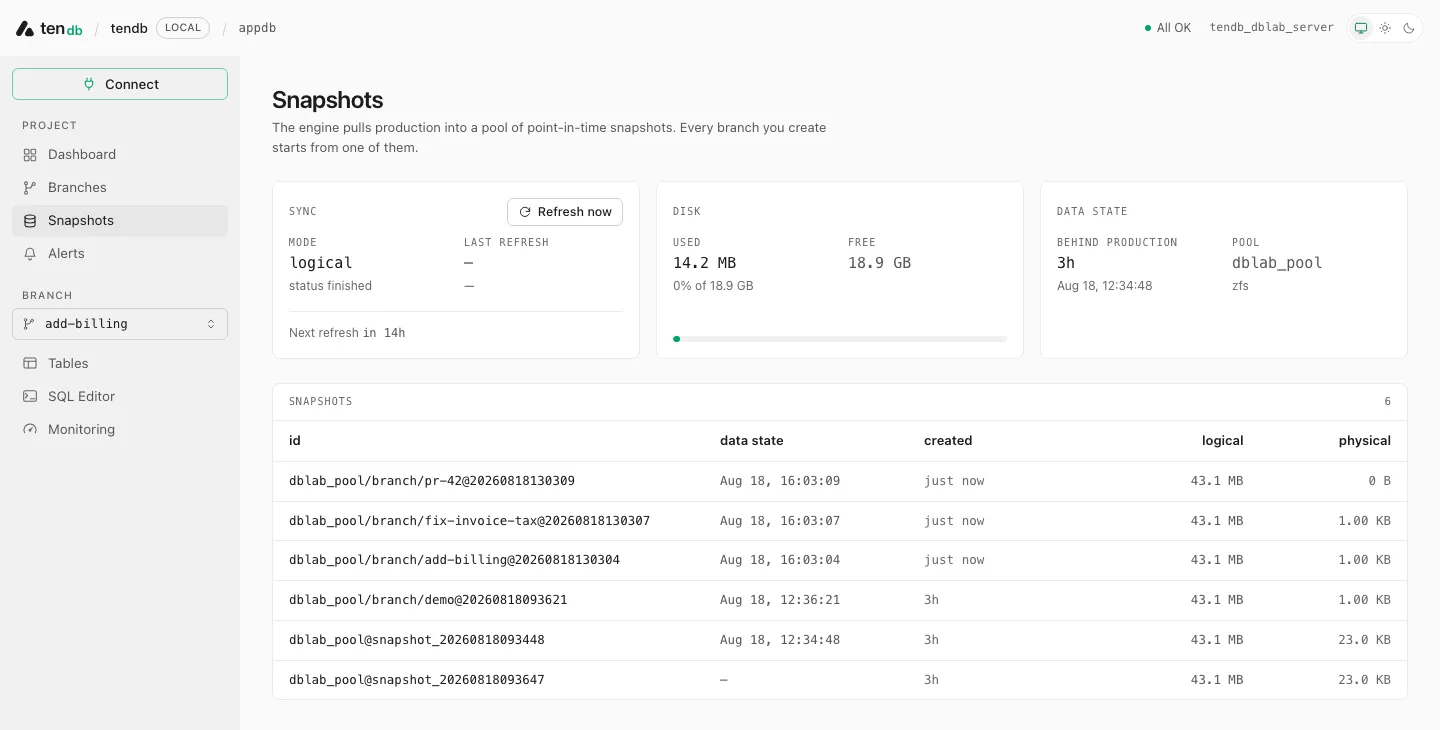
Snapshots — cards for sync status, disk (with warning tones above 80% and danger above 92%), data state, and upstream replication (stream health, slot state, lag bytes, WAL retained per slot, apply/sync error counters). On streaming deployments you also get a Snapshot now button (an O(1) ZFS snapshot — around ten seconds regardless of database size) and a snapshot schedule card — interval choices from manual to daily, retention 1–500 — saved to SSM and picked up by the engine host within seconds. On dump-mode deployments a Refresh now button triggers a full dump/restore refresh when the engine supports it. Below the cards, the snapshot table lists id, data state, age, and logical/physical sizes. See Data refresh for how the two sync modes differ.
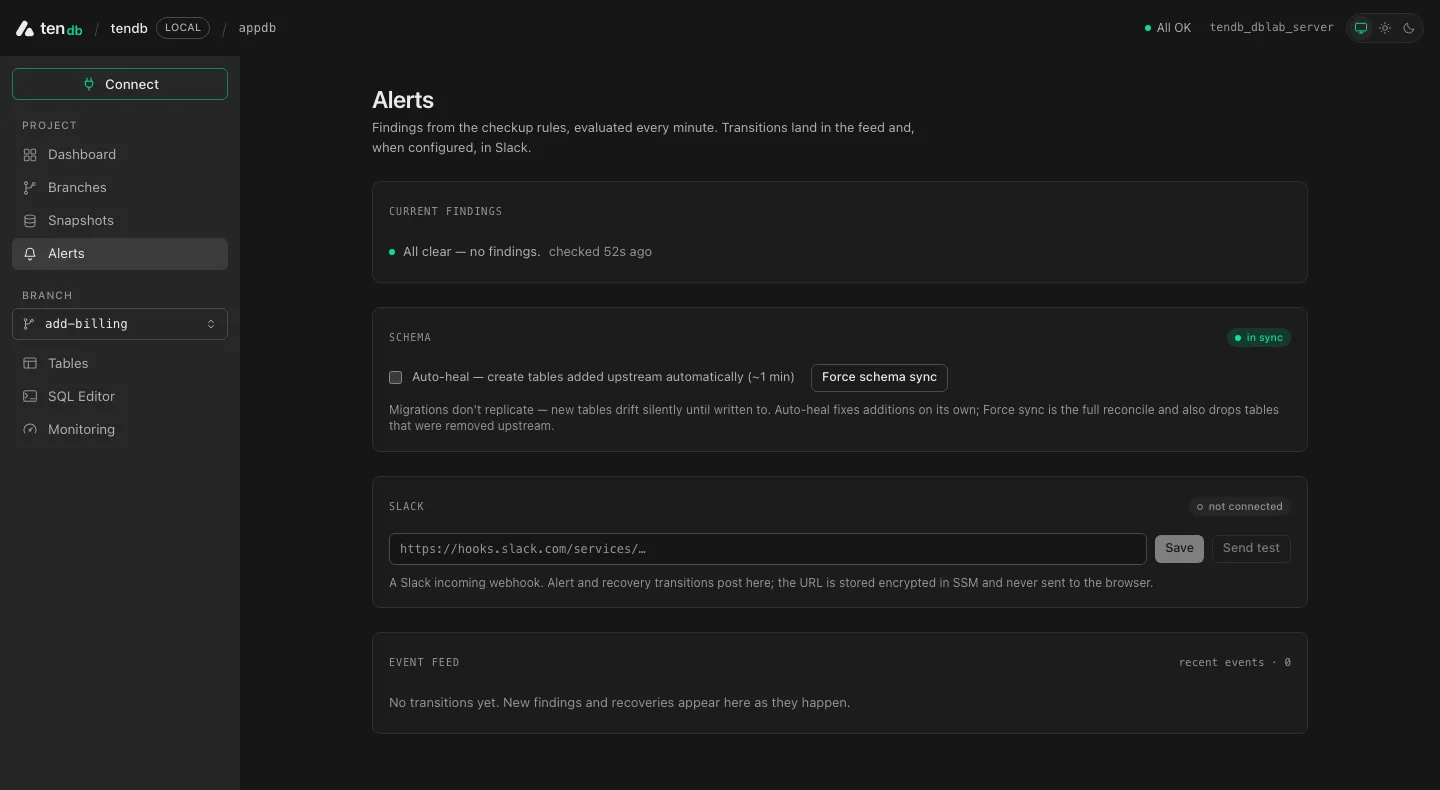
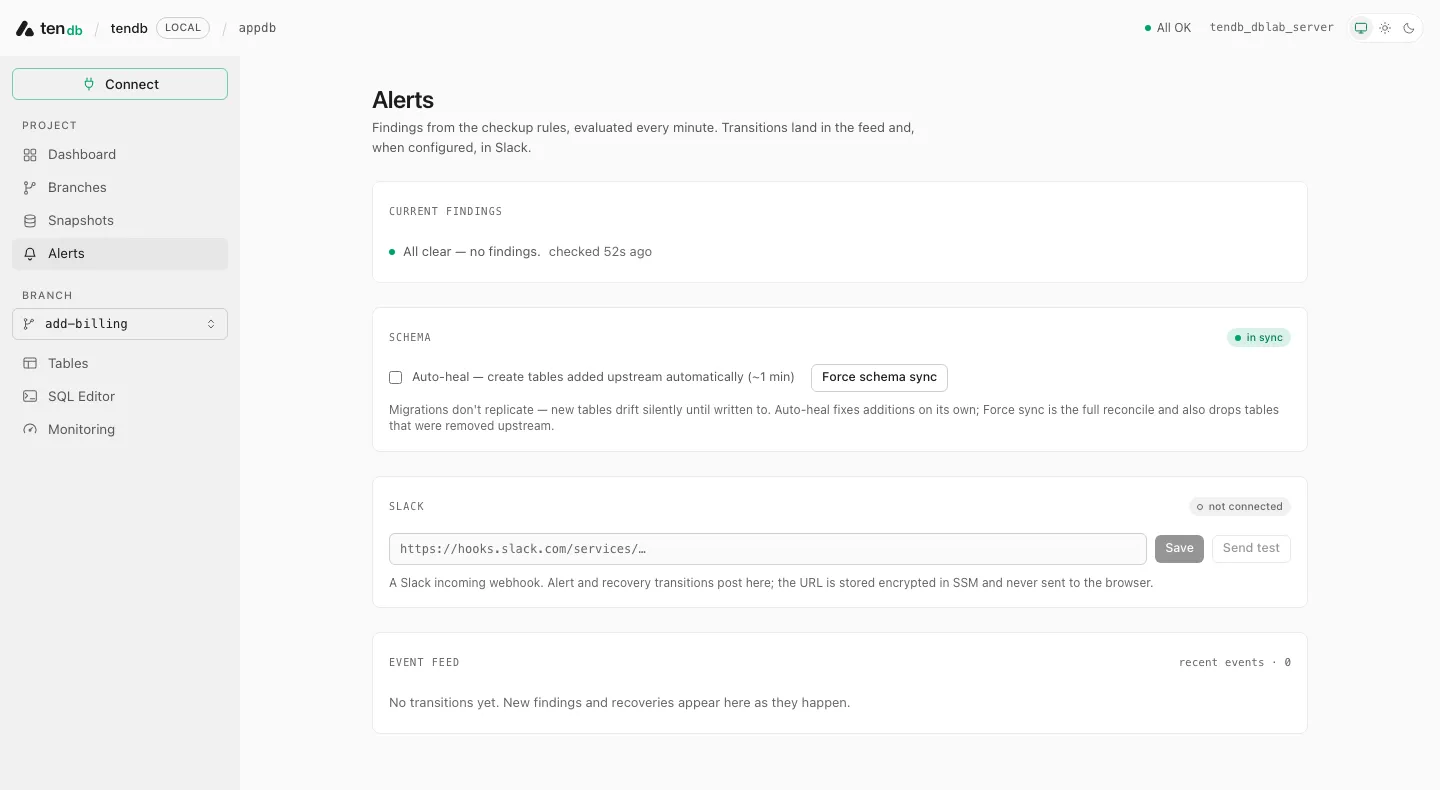
Alerts — current health findings with severity pills, plus:
- Schema card (streaming): drift status and a Force schema sync button for a full reconcile — destructive (it drops tables removed upstream), so it asks you to type
approvefirst. The auto-heal daemon toggle lives in the CLI:tendb schema config --auto-sync on|off. - Slack card: save an incoming-webhook URL (stored encrypted in SSM), clear it, or send a test message.
- Event feed: alert/recover transitions, newest first, up to 200 events.
The console server itself runs the health check every 60 seconds, diffs findings into alert/recover transitions, and posts to Slack when a webhook is configured — so alerts fire while the console is running, without any extra cron.
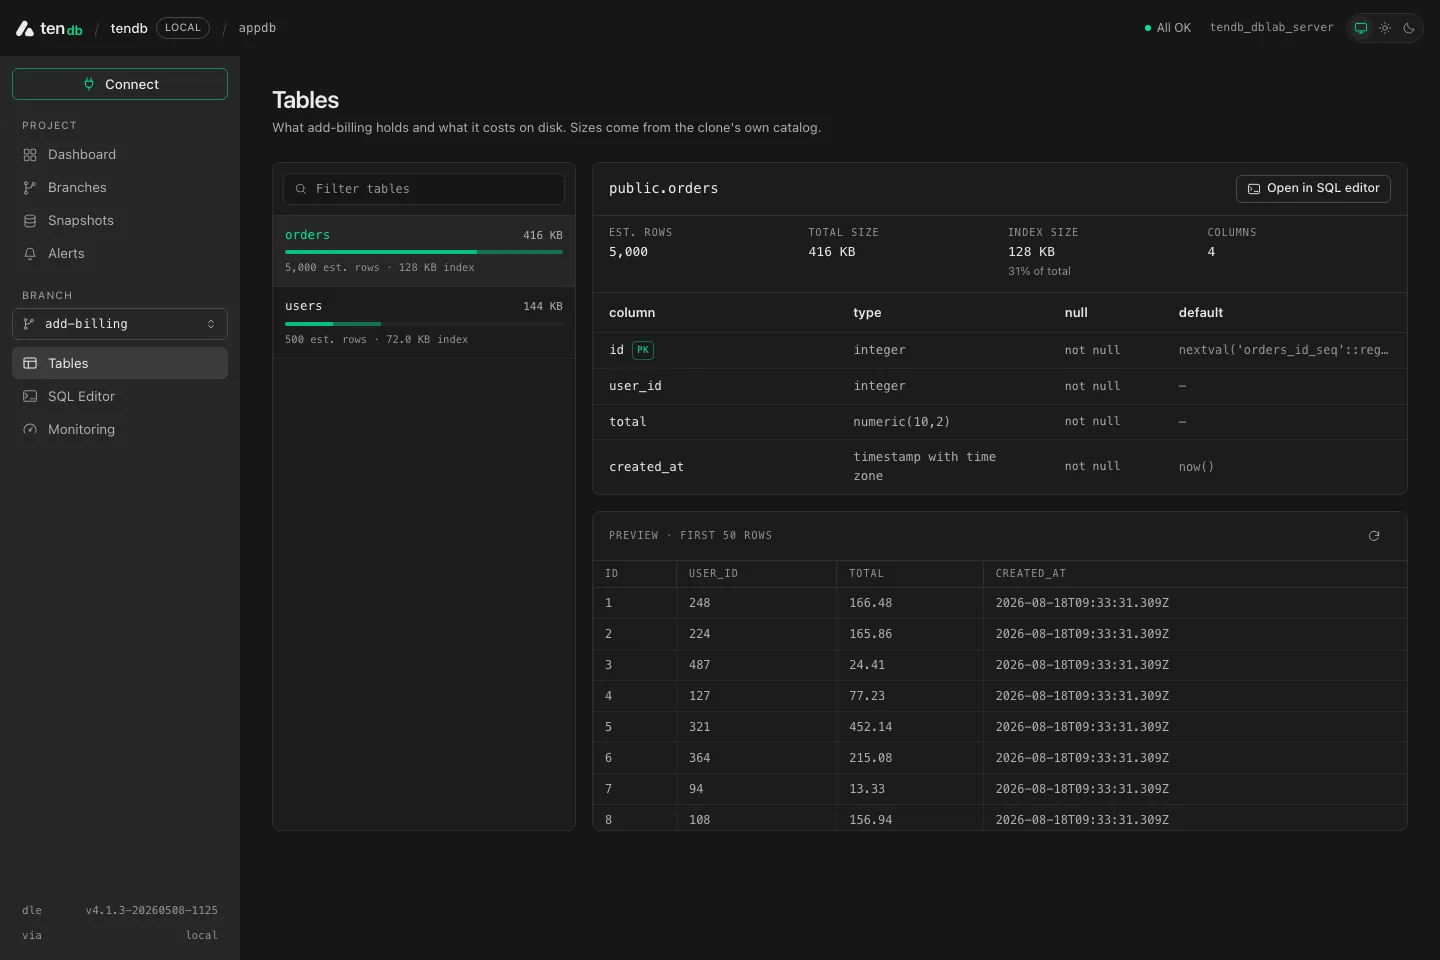
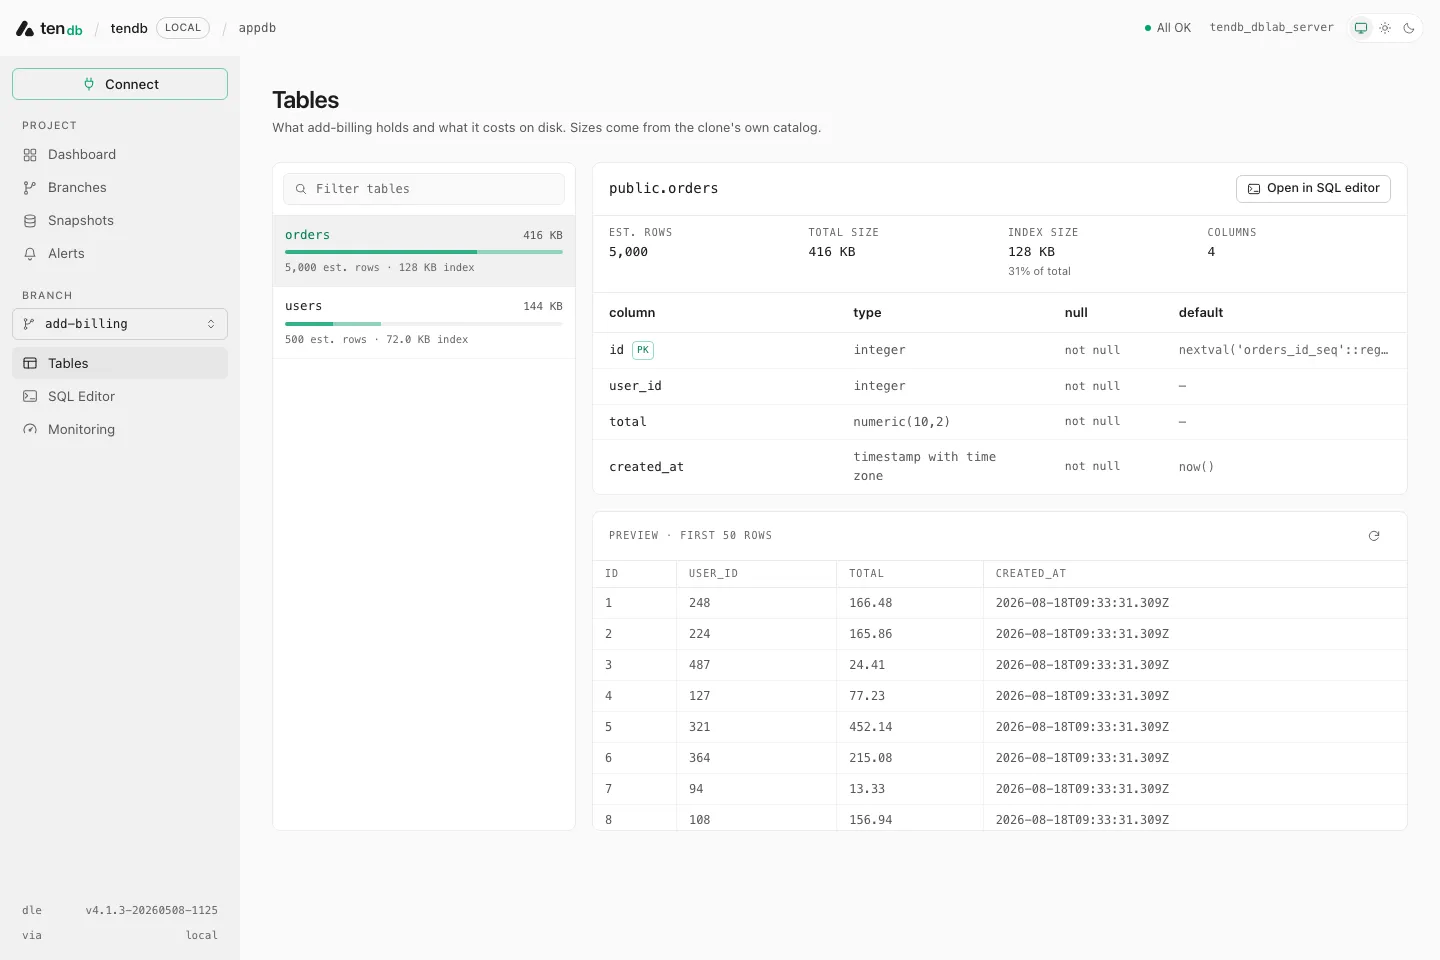
Tables — a schema browser scoped to your selected working branch: filterable table list with heap-vs-index size bars, a detail pane with estimated rows, sizes, and columns (type, nullability, default, primary-key badge), a 50-row preview grid, and an “Open in SQL editor” shortcut.
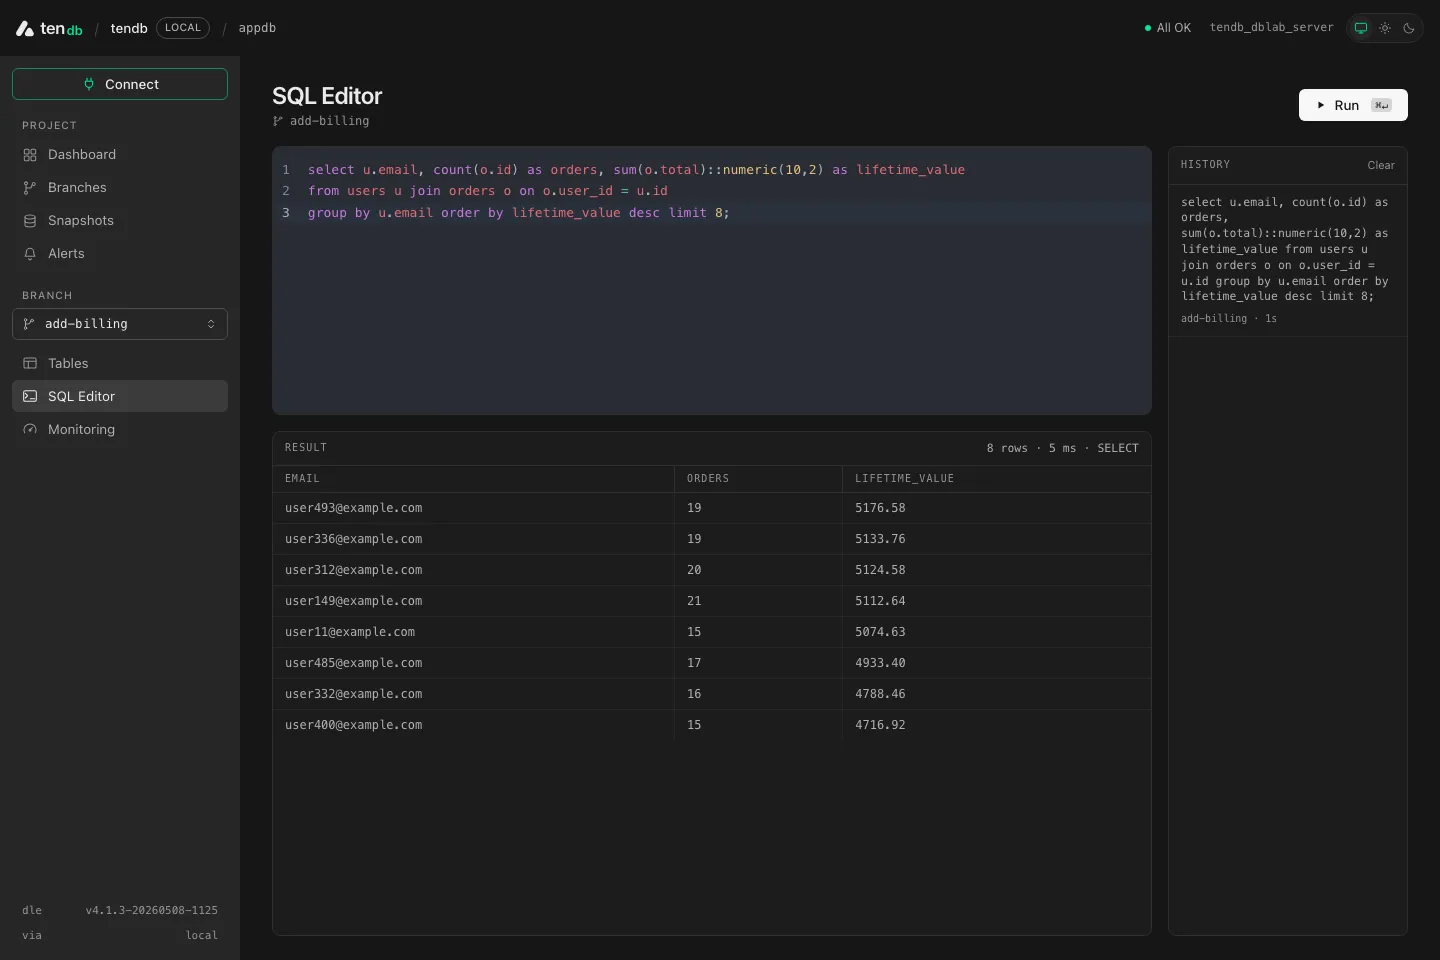
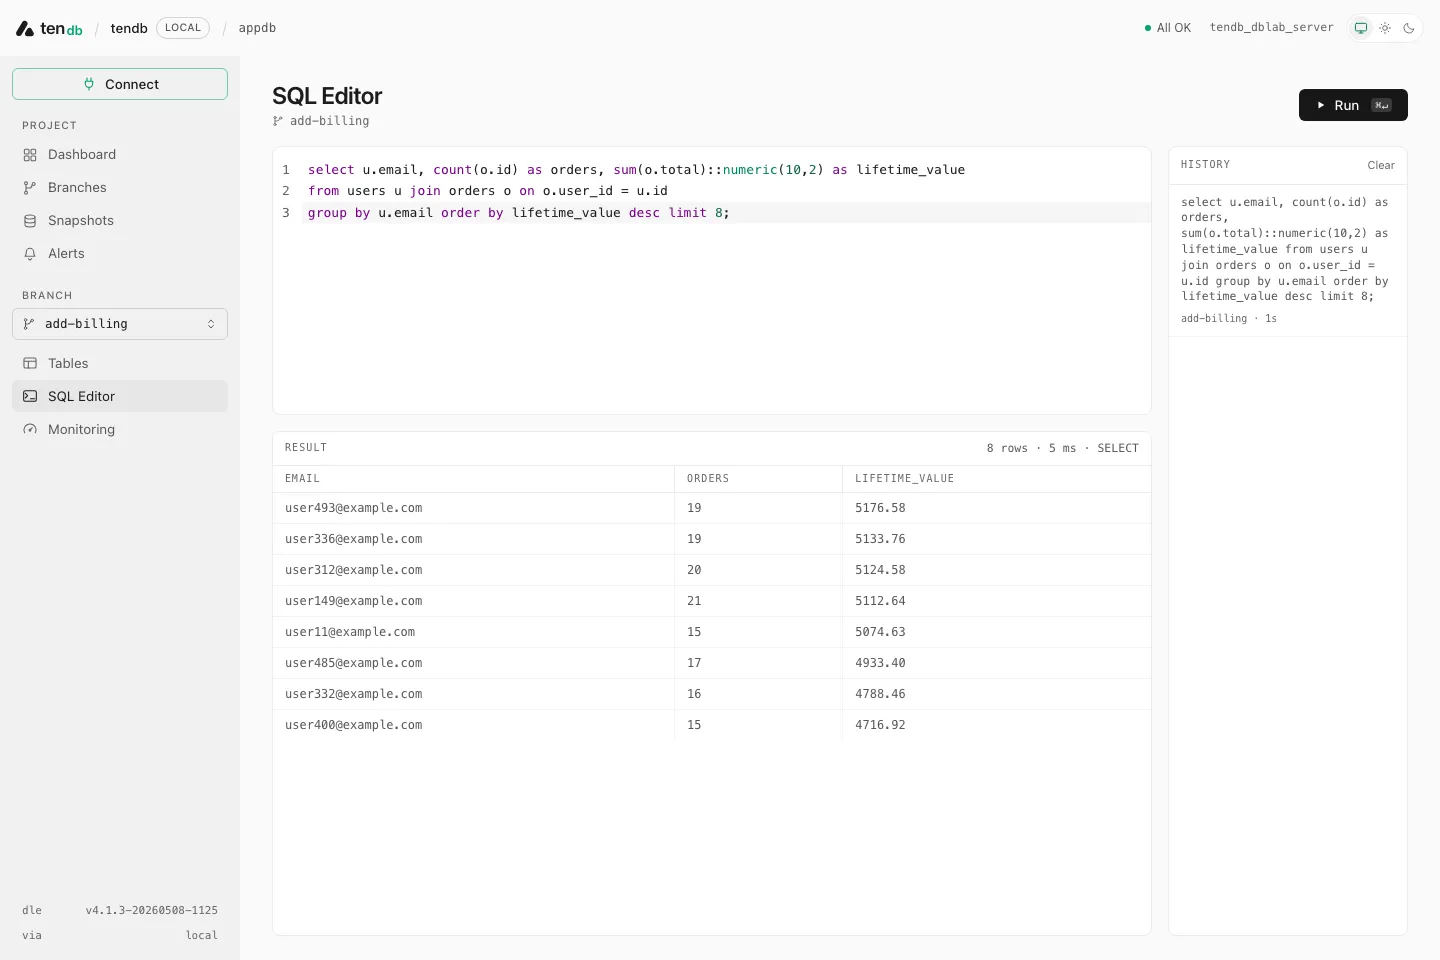
SQL Editor — branch-scoped. Run with ⌘↵/Ctrl+↵; your draft persists across reloads; a history sidebar keeps the last 20 statements. Results show row count, duration, and the command tag, with a warning when output is truncated at 1,000 rows. Postgres errors render with the character position and SQLSTATE code.
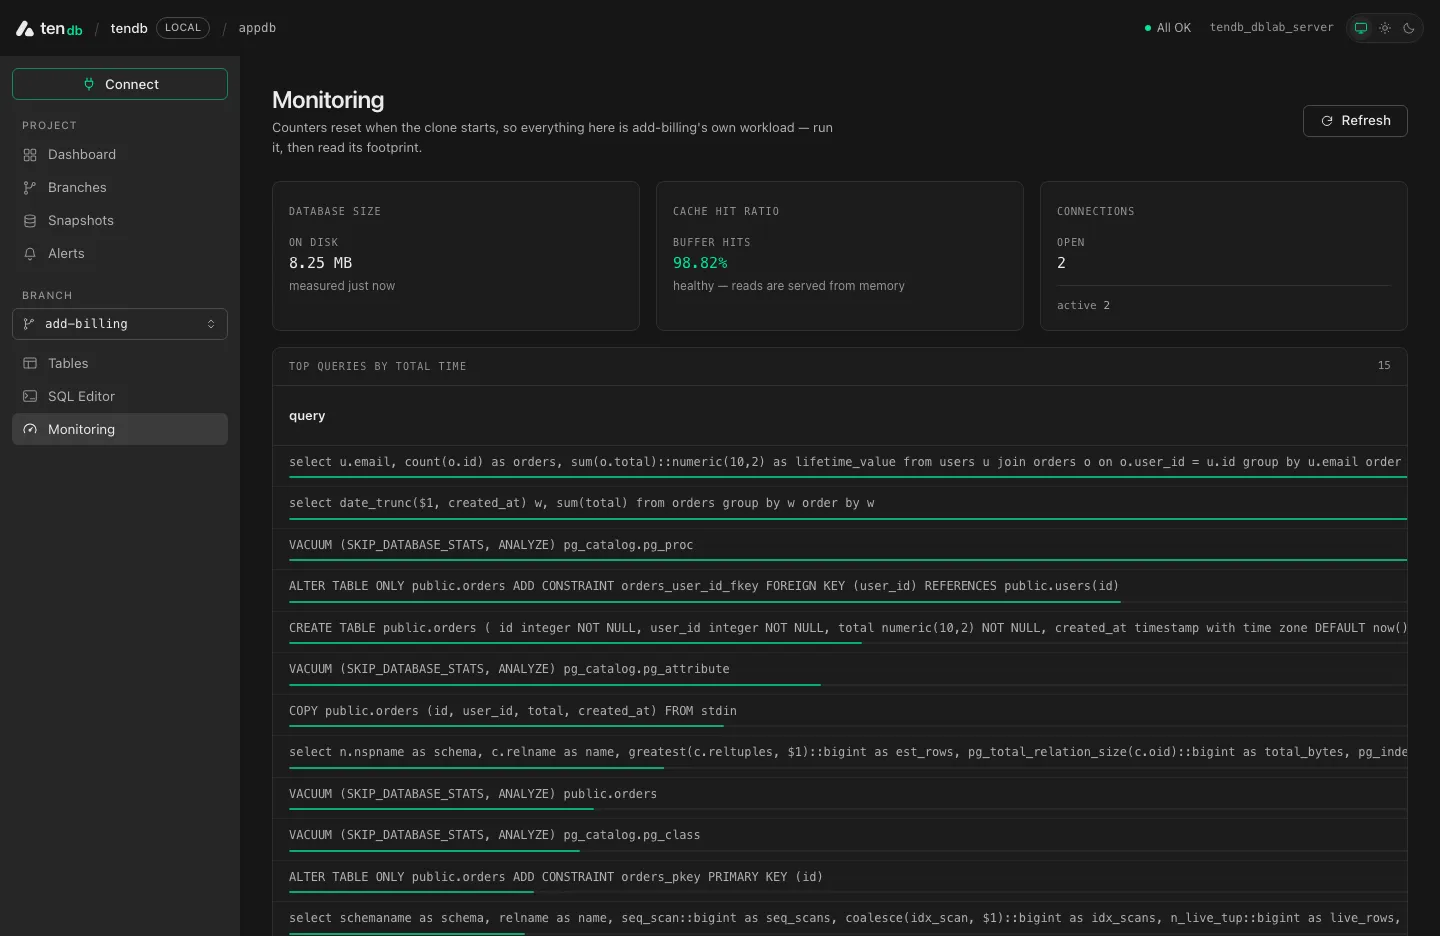
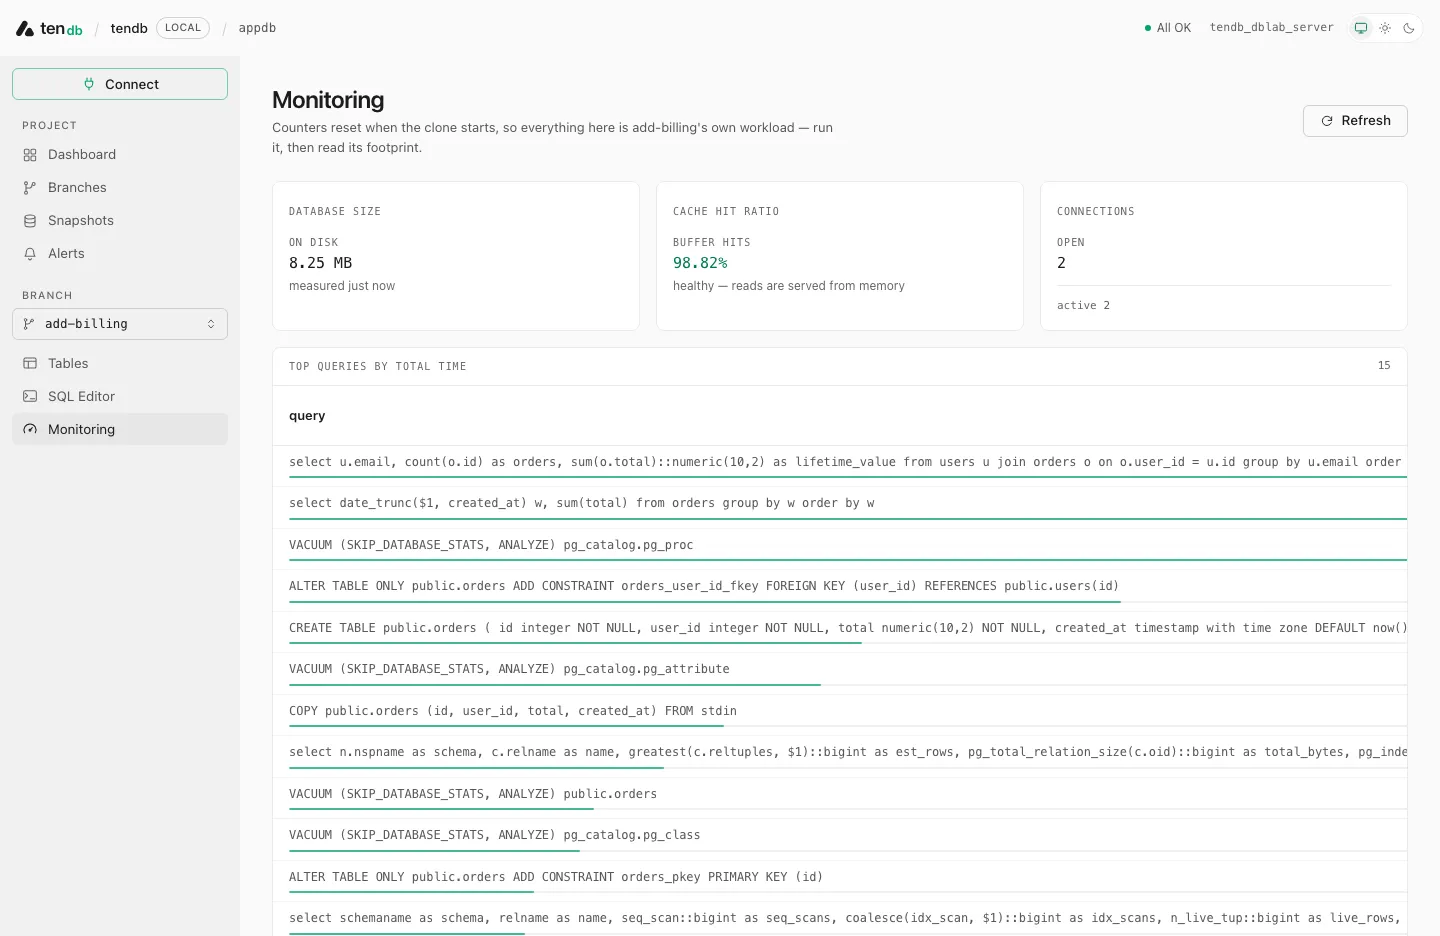
Monitoring — a per-branch performance snapshot, deliberately manual-refresh (polling would distort the very counters it reports): database size, cache hit ratio, connections by state, top queries by total time via pg_stat_statements (created on the clone on demand; degrades gracefully if unavailable), and table activity with a “SEQ” missing-index badge and dead-row bloat highlighting. Counters reset when the clone starts, so what you see is the branch’s own workload footprint.
tendb console vs tendb ui
Section titled “tendb console vs tendb ui”tendb ui is a different, lower-level command: it tunnels to DBLab’s own embedded engine UI (fixed ports 2346 for the UI, 2345 for the API) and prints the verification token for you to paste into its auth field. Use it for raw engine administration; use tendb console for everything day-to-day. tendb ui requires a tunneling platform session (it exits 2 in direct --api-url mode). Full details in the CLI reference.
Hosted console (optional)
Section titled “Hosted console (optional)”The Terraform console module runs the exact same server on a small EC2 instance in your VPC, next to the engine, so your team can open https://console.yourcompany.com without installing anything:
browser ──HTTPS──▶ Caddy (:80/:443, automatic Let's Encrypt) └─▶ oauth2-proxy (:4180 loopback, Google login, email-domain allow-list) └─▶ tendb console (:4400 loopback only, direct TCP to the engine — no SSM tunnels)Caddy terminates HTTPS with automatic Let’s Encrypt certificates, oauth2-proxy enforces Google login restricted to allowed_email_domains, and the console server listens on loopback only. As in local mode, the verification token, clone credentials, and AWS access stay on the host — the browser only ever sees the authenticated UI. The instance has no SSH; admin access is SSM Session Manager.
Prerequisites (one-time, manual)
Section titled “Prerequisites (one-time, manual)”-
A Google OAuth client — created by hand in the Google Cloud console (APIs & Services → Credentials → Create OAuth client ID, type Web application); this step cannot be terraformed. Set the authorized redirect URI to
https://<domain>/oauth2/callback(also emitted as the module’soauth_redirect_urioutput). Store the client as JSON in Secrets Manager:Terminal window aws secretsmanager create-secret --name tendb/console-oauth \--secret-string '{"client_id":"…","client_secret":"…"}'The secret is pulled by the host at boot — it never transits Terraform state.
-
A domain — e.g.
dbconsole.yourcompany.com. If its zone is in Route53, passhosted_zone_idand the module manages the A record. Otherwise leave itnulland create the record shown in therequired_dns_recordoutput yourself; Caddy retries certificate issuance until the name resolves. -
The tendb package — run
pnpm packintendb/cli/and pass the tarball path (package_tarball_path); Terraform uploads it to a private S3 bucket and the host installs it at boot. Alternatively setnpm_package_spec = "@10play/tendb@x.y.z"to install from npm. Exactly one of the two must be set.
Enabling it in the standalone example
Section titled “Enabling it in the standalone example”If you deployed with the standalone example, flip enable_console and fill in the console variables:
enable_console = trueconsole_domain = "dbconsole.yourcompany.com"hosted_zone_id = null # or your Route53 zone idacme_email = "you@yourcompany.com"oauth_secret_arn = "arn:aws:secretsmanager:…:secret:tendb/console-oauth"allowed_email_domains = ["yourcompany.com"]package_tarball_path = "../../../cli/10play-tendb-0.1.0.tgz"The example wires everything else for you: it places the console in the network module’s engine subnet (public in the default network mode) and passes engine_ssm_prefix = module.engine.ssm_prefix. After terraform apply, the console_url output is your dashboard.
Using the module directly instead:
module "console" {  source = "github.com/10play/tendb//packages/tendb/terraform/modules/aws/console"
  vpc_id    = module.network.vpc_id  subnet_id = module.network.engine_subnet_id # must be a PUBLIC subnet
  domain                = "dbconsole.yourcompany.com"  hosted_zone_id        = null  acme_email            = "you@yourcompany.com"  oauth_secret_arn      = "arn:aws:secretsmanager:…:secret:tendb/console-oauth"  allowed_email_domains = ["yourcompany.com"]  package_tarball_path  = "${path.root}/../../cli/10play-tendb-0.1.0.tgz"  engine_ssm_prefix     = module.engine.ssm_prefix}
Two requirements for reaching the engine:
- Discovery:
engine_ssm_prefixpoints at the engine module’sssm_prefixoutput. At every service start the host re-reads the engine’s address, verification token, database name, and (if present) replication URLs from SSM, then dials the DBLab API directly athttp://<engine-private-host>:2345— no SSM tunnels in-VPC. - Network admission: the engine’s security group must admit the console — either the console’s subnet is covered by the engine’s
allowed_cidr_blocks(the standalone example’s VPC-CIDR rule does this), or pass the module’ssecurity_group_idoutput into the engine’sallowed_security_group_ids. See the engine module reference.
The console module’s own security group opens 80/443 to the internet by design — the auth boundary is oauth2-proxy (Google login), not the network. Sessions use a secure cookie with a 12-hour expiry.
Operations
Section titled “Operations”- Token rotation or engine replacement — the console caches its environment at service start, so run
systemctl restart tendb-consoleon the console host (via SSM Session Manager) and it re-fetches everything from SSM. - Releasing a new package version (tarball mode) — re-run
pnpm pack, thenterraform apply. A systemd updater on the host polls the S3 object’s ETag every 15 seconds and installs the new version in place (~20 seconds, no instance replacement, no certificate churn). Innpm_package_specmode there is no updater: changing the spec changes the boot script and replaces the instance. - Changing access — edit
allowed_email_domainsand apply. Note this also replaces the instance. - Alert state — the hosted service sets
TENDB_STATE_DIR, so the alert feed and Slack dedup state survive restarts and releases. - Cost — t3.small + Elastic IP + 16 GB gp3 ≈ $18/month.
Next steps
Section titled “Next steps”- Security model — where the verification token lives and why the browser never sees it.
- CLI reference — everything the console does, scriptable.
- CI previews — the
tendb cicontract for pull-request databases.